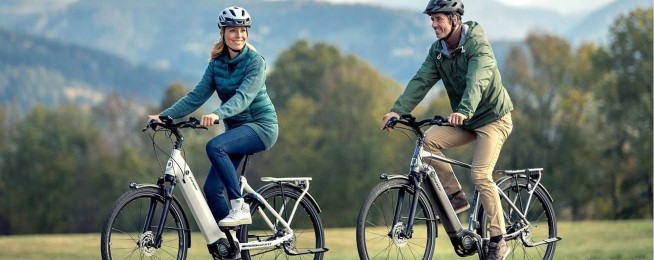
There is no doubt that e-bike is surging in popularity. Pre-pandemic, sales of e-bikes tripled between 2016-2019. Naturally, with the reported boom in sales of general bicycles during the pandemic, sales of e-bikes followed suit, albeit more exponentially.
In 2020, the UK saw a 47% increase in Google searches for e-bikes. This increase is also translating into sales, with a 114% year-on-year increase in e-bikes and e-scooter sales.
The e-bike advantage outlined the following reasons for its popularity.
- It’s easy.
- It boosts confidence when riding in traffic.
- You arrive fresh when you Ride2Work.
- It’s the healthy alternative.
But what about its impact on the environment? While the emissions output of an e-bike is near-zero, one might argue that the manufacturing of e-bikes leaves behind a larger carbon footprint.
They might be right. But it really depends on the user.
The 2021 sustainability report by Trek calculated that the carbon cost in manufacturing an e-bike can be mitigated or entirely offset when it is used to its fullest potential.
Let's put it this way. If you were to ride for 430 miles (or almost 700km) instead of driving the same distance, you would basically offset the carbon equivalent of what it takes to manufacture one of Trek’s most popular bike models.
Take the same bike for a longer ride, and you could essentially be carbon negative.

Compare this with cars (and electric cars): there is no contest.
The European Cycling Federation (ECF) estimates about 96kg of carbon dioxide equivalent (CO2e) to manufacture a bicycle, and 134kg of CO2e to manufacture an e-bike. Meanwhile, it takes an average of 5,500kg of CO2e to make a small hatchback, and 13,000kg of CO2e to make an SUV.
That's a difference of more than 40-fold.
The difference is far more evident if we consider the life-cycle analysis (which includes the rider's intake of food and its carbon footprint).
At a lifetime travel of 19,200km, a bicycle produces 25-35g CO2e/km. E-bikes come in lower at 21-25g CO2e/km, which is less carbon intensive as the rider is doing less work and potentially reducing their food footprint. Meanwhile, a typical car produces 220g CO2e/km with 180,000 lifetime kilometres, and an electric car average about 160g CO2e/km.
Switching to an e-bike from a daily car journey can save an average of 249g of CO2 for every km travelled. Scale it up for e-bikes to replace car travel entirely, and we’re looking at a reduction of 30 million tonnes of CO2 a year (that’s half of all of England).
You can read more in this wonderful e-report by The Bike Storage Company here.
It appears that e-bikes should be the go-to for users who would need to travel further, and would also want to cut their carbon footprint. However, e-bikes are more expensive than traditional bicycles, and may not be as affordable for everyone who are looking to commute longer distances by bike. Schemes like an e-bike subscription and the slow, but steady, growth of e-bike sharing services can help with that.
If you are looking into getting an e-bike, but have more questions than is comfortable for you to drop the dough on getting one, our quick intro to e-bikes may help. It is also important to consider other options when you’re deciding on the type of bike you’ll need to get riding.
This article was made possible by the support of Bicycle Network's members who enable us to make bike riding better in Australia.
Become our friend
Find out more about Bicycle Network and support us in making it easier for people to ride bikes.


