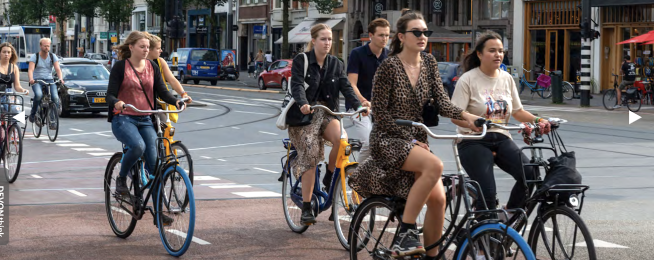
The Dutch make 28 per cent of all trips by bicycle, about 17.6 billion kilometres a year.
That’s about 3.0 km per day per person.
Is it any wonder that they are a healthy bunch?
According to a new release of cycling data from the Netherlands Institute for Transport Policy, 80% people who use bikes for virtually all their trips exceed the minimum advised amount of weekly exercise (150 minutes a week) just from everyday riding.
Only (7%) of car drivers meet the target.
Bicycle ownership rates are higher for people with healthy body weights than for the overweight or obese. People of healthy body weights also cycle significantly more and longer distances than the overweight or obese.
The report is full of fascinating facts, figures and charts that show have the Netherlands has made bike riding a normal part of its modern economy.
Bicycles are the key transport mode for home-work commutes of up to 5 kilometres.
Working people use bicycles for approximately 27% of their home-work commutes. This percentage is higher for those who travel relatively short distances—55% of working people residing within 5km of their workplaces commute to work by bicycle, while this figure is 31% for those residing between 5 and 10km from their workplaces, and 14% between 10 and 15km.
Trips for leisure purposes account for one-third of the total distance cycled, followed by bicycle trips for shopping purposes and home-work commutes
The Dutch cycle the furthest for leisure purposes and the shortest distances for shopping.
Women cycle more than men: in total, women account for some 17% more bicycle trips per year (2.4 billion compared to 2.0 billion).
E-bikes account for approximately 18% of all bicycle trips and for more than one-quarter (26%) of the total distance cycled: this amounts to some 700 million e-bike trips, covering more than 4.1 billion kilometres.
E-bike trips are 60 per cent longer. A non-electric bicycle’s average trip distance is approximately 3.6 km while an e-bike’s average trip distance is 5.9 km. People aged 75+ cycle the longest average distance per e-bike trip (7.2 km), as they relatively frequently use e-bikes for touring.
Thirty two percent of bike rider deaths involved people riding e-bikes, yet e-bikes account for 18% of all bicycle trips, and 26% of the total distance cycled.
Most bicycle traffic fatalities involve people aged 70 and older.
Even more data is available in the full document.
Become our friend
Find out more about Bicycle Network and support us in making it easier for people to ride bikes.


