
Two surveys were released last month which point to the barriers facing people who want to ride in Tasmania.
The National Cycling and Walking Survey was undertaken earlier this year and disappointingly has found Tasmania has one of the worst rates of bike riding participation in the country.
The survey includes all types of bike riding and riders aged more than two years.
All states dropped from the COVID lockdown highs recorded in the 2021 survey but stayed higher than pre-pandemic rates, except for Tasmania.
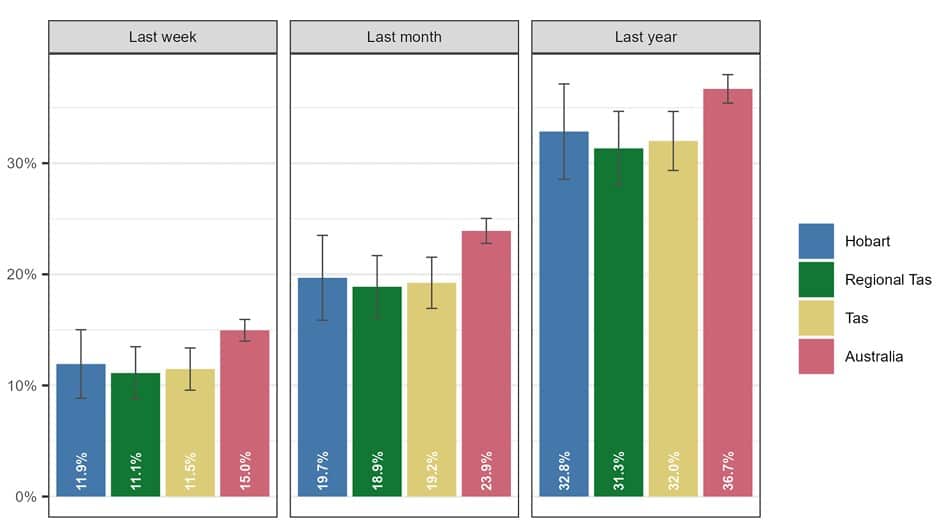
The national average for the number of people who rode bikes in the past year was 36.7% which is the highest it’s been since 2013, excluding the pandemic high of 40.1% in 2021.
In Tasmania it was 32%, which is the lowest its been since the survey started in 2011.
So why the bigger drop in Tasmania? Some of the reasons include three years of La Nina weather patterns; frequent wet weather can turn some people off riding.
The other is no new significant infrastructure has been built. While several new paths have been delivered in the north-west of the state few new places to ride have been delivered in the south or north.
The people surveyed may have just not been bike riders. In 2013 the numbers were also much lower than for other years, which shows there can be some years when the sample selected may be representative in terms of age and location but not bike riding propensity.
Transport emissions
The University of Tasmania has published the results from its transport emissions survey of 864 Tasmanians. While this was a self-selecting survey rather than randomly selected, the university has weighted it for age, gender and income so it’s more reflective of the general population.
The survey was skewed towards a car driving perspective, but it did ask some questions about bike riding.
Just over 24% of respondents said they were willing to bike ride more for transport and more than 80% of respondents said safety was a barrier to riding more often.
Other significant barriers included living too far away to ride/walk, poor access to good quality paths or bike lanes, and riding/walking taking too long.
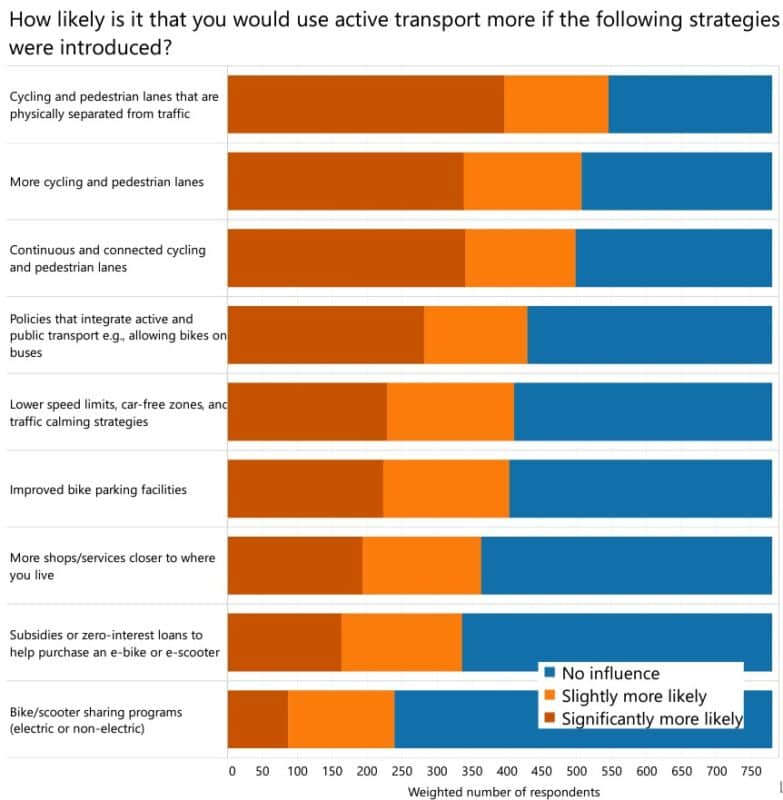
However, more than 70% of respondents said more bike lanes physically separated from traffic would encourage them to ride for transport. Other popular suggested improvements were better connectivity of bike lanes, permission to take bikes on buses, lower speed zones and traffic calming.